Data Analyst, Data Visualist, and Front-End Engineer
About Me
Hi! I am a skilled data profesional and a lifelong basketball junkie. After my playing career ended at the high school level, I got my first job in hoops as a Student Manager for Texas A&M Men's Basketball. After getting to work under two head coaching regimes during my time there, I realized my dream was to have a long career working in basketball.
Since then, I've been able to build valuable experience both in and out of basketball. However, my passion towards working in hoops has not faded, and I am more determined than ever to earn a role in an NBA front office. I miss working hard as part of a team towards a common goal, and there are so many things about working in sports that I haven't found to be replicated in any of my other roles. I am confident in the skillset that I have been building, and I am excited to find a role where I can make significant contriutions while continuing to learn and grow every day!
This project was inspired by Chapter 19: The Problem with Scorers in the Basketball Analytics classic Basketball on Paper, by Dean Oliver. The offensive skill curve is the building block of this chapter by Oliver. It essentially shows how a player can produce higher offensive ratings when they don’t have to carry as much of the load on offense. Or, vice versa, it shows that the higher usage a player accounts for, the less efficient they can be with it.
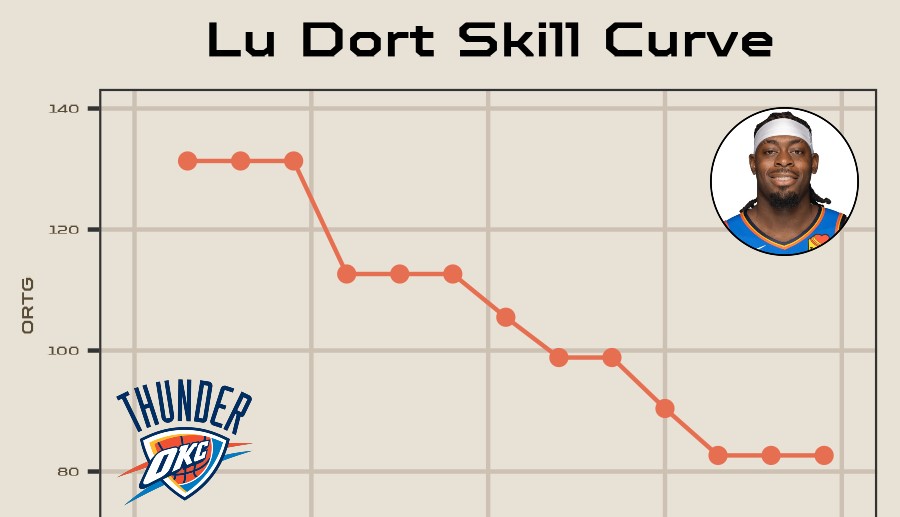
The starting point of this project is trying to recreate Oliver's skill curves on today's NBA players. Once that concept is nailed down, there are different applications I can try to apply it to. In the book, Oliver solves for the optimal usage rate that each of the 5 players on the court should have to maximize team ORTG. There is analysis that can be done down this route for todays NBA. I am also curious about how players' skill curves develop through the cycle of a career. Lastly, I had the idea of building an app that could calculate ORTG for theoretical lineups, so users could see how ORTG would be expected to change when substituting one player in for another.
Recent Application of the Concept
After T.J. McConnell impressed many basketball viewers in the NBA Finals, a tweet went sort of viral for all the wrong reasons.
If @NBA_University was familiar with the concept of a skill curve, they would understand how wrong they were. Take a look at my calculated skill curves for the two players.
As you can see, at each level of usage, Brunson can produce a higher ORTG on that volume than McConnell can, and my skills curves are probably making it look closer than it really is, considering I'm still working out some low-sample/padding adjustments that I want to make.
In November of both 2023 and 2024, the Arizona State University Law School hosted an NBA Mock Trade Deadline Competition to provide participating students from around the country the opportunity to simulate working in an NBA front office just before the NBA trade deadline and receive feedback from real NBA executives as judges, as well as valuable networking opportunities. I got involved with the organizers of the event and volunteered my time and skills. I took on the responsibility of constructing the technology that participants and judges would rely on throughout the weekend.
My Work
At asuntdc.com, participants had the option to access the trade entry portal and the transaction log. All apps were optimized to fit on computer screens, as well as mobile phones or tablets, since that was the tool of choice for many users.
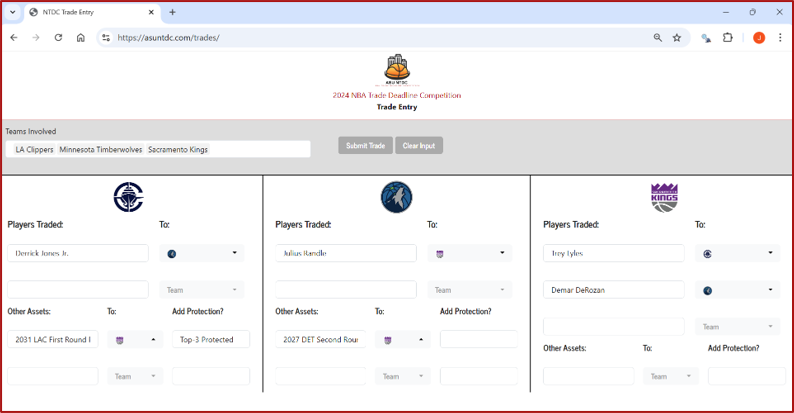
Participants entered their own trades via the trade entry app. The app could support from 2-6 team trades with up to 30 assets being traded away from each team, as well as 1 team transactions (for waiving players). I was confident the app was prepared to handle any move that participants could dream up!
After entering their trade into the system, participants had the ability to review, then submit their deals.
They then received a 5-digit transaction ID that they would have to take to the judges so that the trade may be checked for legality and approved to become an official trade. Participants could put as many trades as they wanted into the system, and none were reviewed or declared official until all parties represented in the trade appeared at the judges table with their transaction ID.
The trade checkers then had their own seperate, private portal where they entered this ID. The proposed trade would load in from the database, and they would complete their checks and come to a decision.
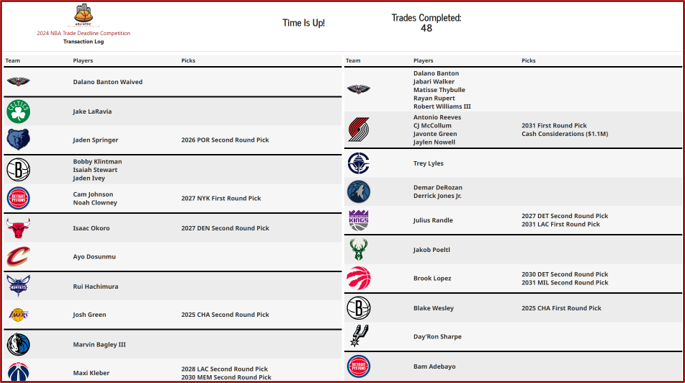
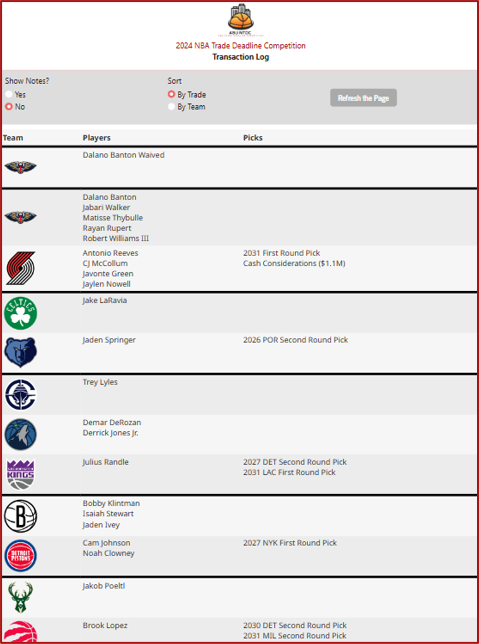
Once a trade became approved by the judges, it would immediately be reflected on the transaction log for all to see. There were two versions of the transaction log: the one participants could access via their link, and one that was optimized to display on the large projector in the room everyone was in.
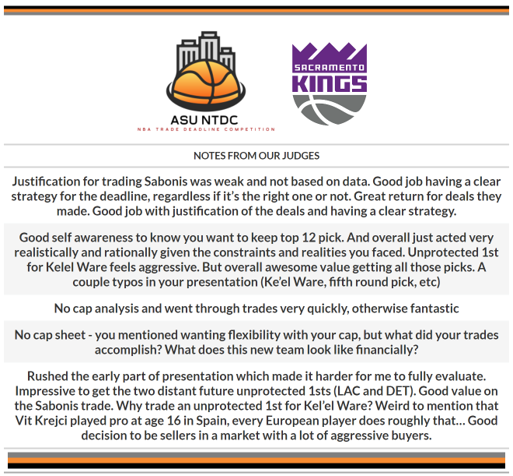
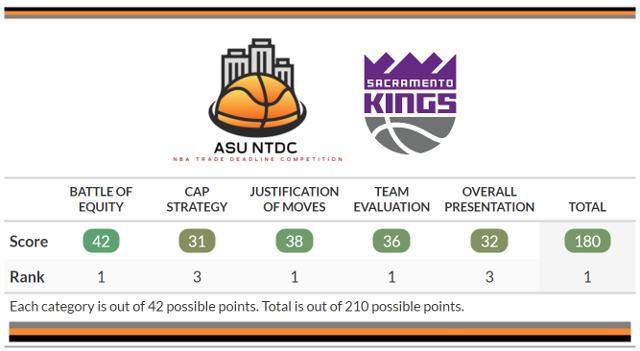
My last major responsibility was to create a script I could run after all the judge’s data and responses were collected online that would generate an output we could send to each team as results/comments.
This is one of my favorite projects I've ever worked on. I wanted to teach myself Shiny, so I decided I would create a "Pre-Scout" app for college coaches where they could click through multiple different tools and get a good overview of a team they may be unfamiliar with. This could act as a precursor or supplement to film review. After I developed this portal, I ran it throughout the length of the 2023-24 college basketball season for 4 programs, all of which were NCAA Tournament teams that season. Each team had their own team specific portal and URL that automatically updated for them daily as the season progressed.
Backend
To gather the data for this portal, I set a job for a webscraping script I wrote to run daily. I used the piggyback package and github releases to store, update, and retrieve the data into the apps. My daily webscrape included scraping data from sites like Sports Reference, ESPN, and Kenpom, as well as downloading and cleaning play-by-play data straight from the NCAA's website. At any given time, the user could select from any of their next three opponents to view the tools for within the pre-scout portal.
Graphical Metric Comparison
A simple tool that allows you simply view the your own and the opponent's play style metrics compared to the other teams on your schedule that season, or compared to the top teams in the NCAA acorrding to NET or the AP Poll. This tool allows you to get a high level overview of the opponents strengths and weaknesses, see how they compare to your own, and relate them to teams you may be more familiar with.
Player Personnel
The player personnel table aggregates many standard statistics and player info, but allows you to simply filter, sort, and customize to just the information you want to see. You can sort to see who takes 3s at the highest rate, a breakdown on how often each player is estimated to be playing each of the 5 positions, or filter to bigs and see how many minutes each play per game. None of the information in this table is unique to this portal, but I believe it's presented in a way to maximize efficient usefulness.
Player Style Comparison
This tool provides an at a glance overview of the playstyle of opposing players. Broken down into a handful of categories, the plot shows you which segments of the game each player excels or does not impact the game in across several key categories that are different for each position. It then compares those skills to a stylistically-similar NBA player. The intended purpose of this tool is for coaches getting ready for an early season game against an unfamiliar small school to be able to relate their opponent to players they have more skillset familiarity of.
Even though it looks like it, when computing similar player styles, headshots are not taken into account!
Opponent Trends
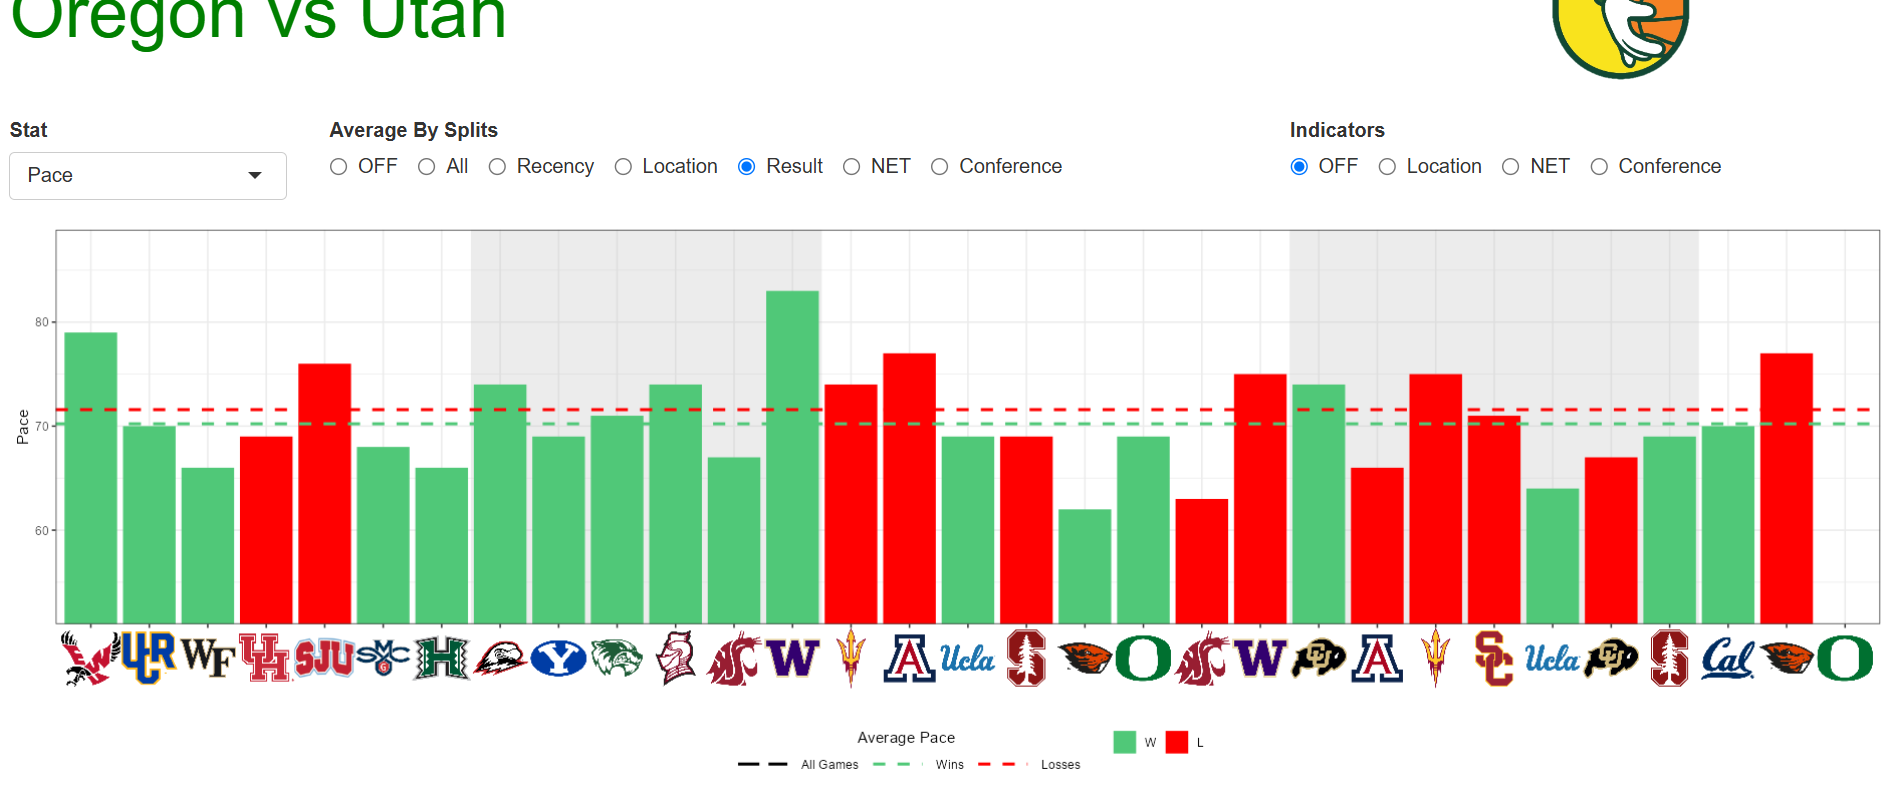
The Opponent Trends tools allows users to see how their opponent has performed in key offensive and defensive categories throughout the season, game by game. Is the opponent in the middle of an extended 3P shooting slump? Has the opponent been playing with higher pace this month than the last two? You can use this tool to try and find insights such as these much more quickly that clicking through game logs.
This tool also allows users to insert trend lines split by multiple categories. Does you opponent rebound at a much higher rate at home than on the road? Do they draw a significantly higher rate of fouls in wins than losses? These insights could provide things to key in on for film study, and possible be keys to the game.
Rotation Visualization
Lastly, the rotation visualization tool. This tool lets you see when players for the opposing team are most commonly in and when they most often take their rest on the bench.
You can also filter the information in some useful ways. Want to see how much the starters have been playing in the last 5 games? Or how about what the guard rotation was in your matchup against them from last month?
The goal of this project was to use machine learning to create a model that will predict the outcome of any NBA playoff series. Then using this model, I can find the probability of any team in the playoff bracket winning a series against any other team in the bracket. I then apply this to the 2024 NBA Playoffs to see the predicted probability of each playoff team advancing to each round based on the bracket structure.
After recently getting married and working on merging financial workflows with my wife, I realized that the process that I used for myself as a single guy would be too difficult to implement with two unique users, and that I would need to utilize some different technology so that we could efficently manage our finances. I also decided I wan't a fan of any available apps or websites, and that I wanted to create us something more customizable, where I can just add in exactly what I want without any of the things I don't.
This is an In Progress project, where I currently have a scraper that exports transacations and account balances daily into excel files that I use for end of the month analysis.
My next steps are to build an app that allows the user to catagorize recent transactions manually if they come from an unfamiliar vendor and auto-catigorization from frequent vendors. Then I will add some features for month to month spending/saving analysis.
Before the 2023 Free Agency period opened up, I wanted to use my modeling skills and see if I could predict the values and lengths of contracts that players would end up signing (different from predicting how much they were really worth!). I ended up scraping and using data from Spotrac for contracts and Basketball Reference for player stats. Once I created my model and extracted the predictions, I followed up on free agents I found particularly interesting and made some explanations on why my model may have said what it did.
As the 2023 Offseason approaches, I lay out a plan for the Orlando Magic by examining their current state, assets, and goals, then making a plan for the draft, free agency, and all key contract options they will face.
For one of my term projects in school, I wanted to use data science to make predictions on that season's Master's Tournament. I first webscraped the player level results from 16 seasons worth of tournaments. After setting up the data, I developed predictors for my outcome variables (which were Round 1 and 2 scores at the Masters reletive to the median score, and Round 3 and 4 scores at the Masters reletive to the median score).
I then used my predicted round scores and calculated round standard deviation for each golfer in the Masters field to run 10,000 simulations. After the first two rounds in each simulation, players either make or miss the cut, then survivng players will have values simulated for their 3rd and 4th rounds. After running these simulations, I'm able to calculate how often each golfer wins, makes or misses the cut, or finishes top-10. I can then compare these predicted likilihoods to the betting market, and see if my modeling provided us an edge.
One of my favorite hobbies outside of hoops is fantasy football. Being the data enthuiast that I am, I've enjoyed collecting, analyzing, and reporting data from the league I've run with my friends for many years now.
One of the more engaged with content that I put out is a weekly automated power ranking. Each week I use our league rules and team performances to run simulations for the remainder of the season, and report on key metrics. Below is an example of a report from last season.
App
At one point I had developed an app for our league to use, but I did not maintain it and it is not currently functional. This is high up on my list of projects I would like to get back around to when I have the time, since I have improved my skills greatly since I developed it last time.
Our league currently has 11 members, where 1 member each week plays the "Ghost" team, who scores the average of the other 10 teams. This was hard for the team playing against the Ghost to keep track of during the matchup. The initial purpose of the app was to have a live scoreboard that showed the Ghost's current score and projected score, so that it's opponent could follow along easier. Along with that, I ended up including many other features in our league app, including a more customized standings page, up to date playoff seeding page where members could see how far they are from an auto-bid or wildcard spots to the playoffs, a page where members could see who is in the lead for a variety of prize pots, power rankings, season team trends, and a league history page with lots of interesting stats.
For a term project in one of my graduate machine learning classes, I wanted to use pre-Trade Deadline NBA season data to predict how a team would do at the end of the season. I decided to classify teams into 5 categorical outcomes: Championship Contenders, Solid Playoff Teams, Fringe Playoff Teams, Low Lottery Odds, and High Lottery Odds. My model was able to achieve an accuracy just over 75%.
Right before the Trade Deadline is a period of high activity for teams, so I wanted to try to create a model to assess what the teams outcome in the season would be so that teams in the middle, who are "unsure", could have a better idea on what type of trades they should be trying to make. If a good model says you are a fringe playoff team, you wouldn't want to trade significant draft capital for a role player in order to boost your chances of a championship.
2021 Draft Combine Results Portal
Date:
GH Repo:
Brief Overview
As a way to visualize the results for selected players in the 2021 Draft Combine, I created a Shiny app to either view player testing results or to compare two player's results to each other.
When trying to get a GA job with Indiana Basketball, I created a full scouting report on their team from the season prior. This report included offensive and defensive overviews, player personnel, offensive actions, and set plays, all of which I obtained by watching film.
Before the 2021 Draft, I had completed a Python project comparing the play style of NCAA and NBA players based on box score statistics. I used those results as a reference when examining 2021 NBA Draft prospects that I was a fan of.
When I was looking for a college GA job, I decided to preview the upcoming Big-10 Basketball season by aggregating all the happenings around the conference into one central document, hoping that it would be useful to coaching staffs as they prepared for the season. My guide for each team includes key additions, returning, and departing players for each team, a recap of their prior season, and a roster overview including a summary of each rostered player. After seeing this project, I had a coach hire me to produce the same thing for the ACC.